########################
Doubly heatmap circos plot

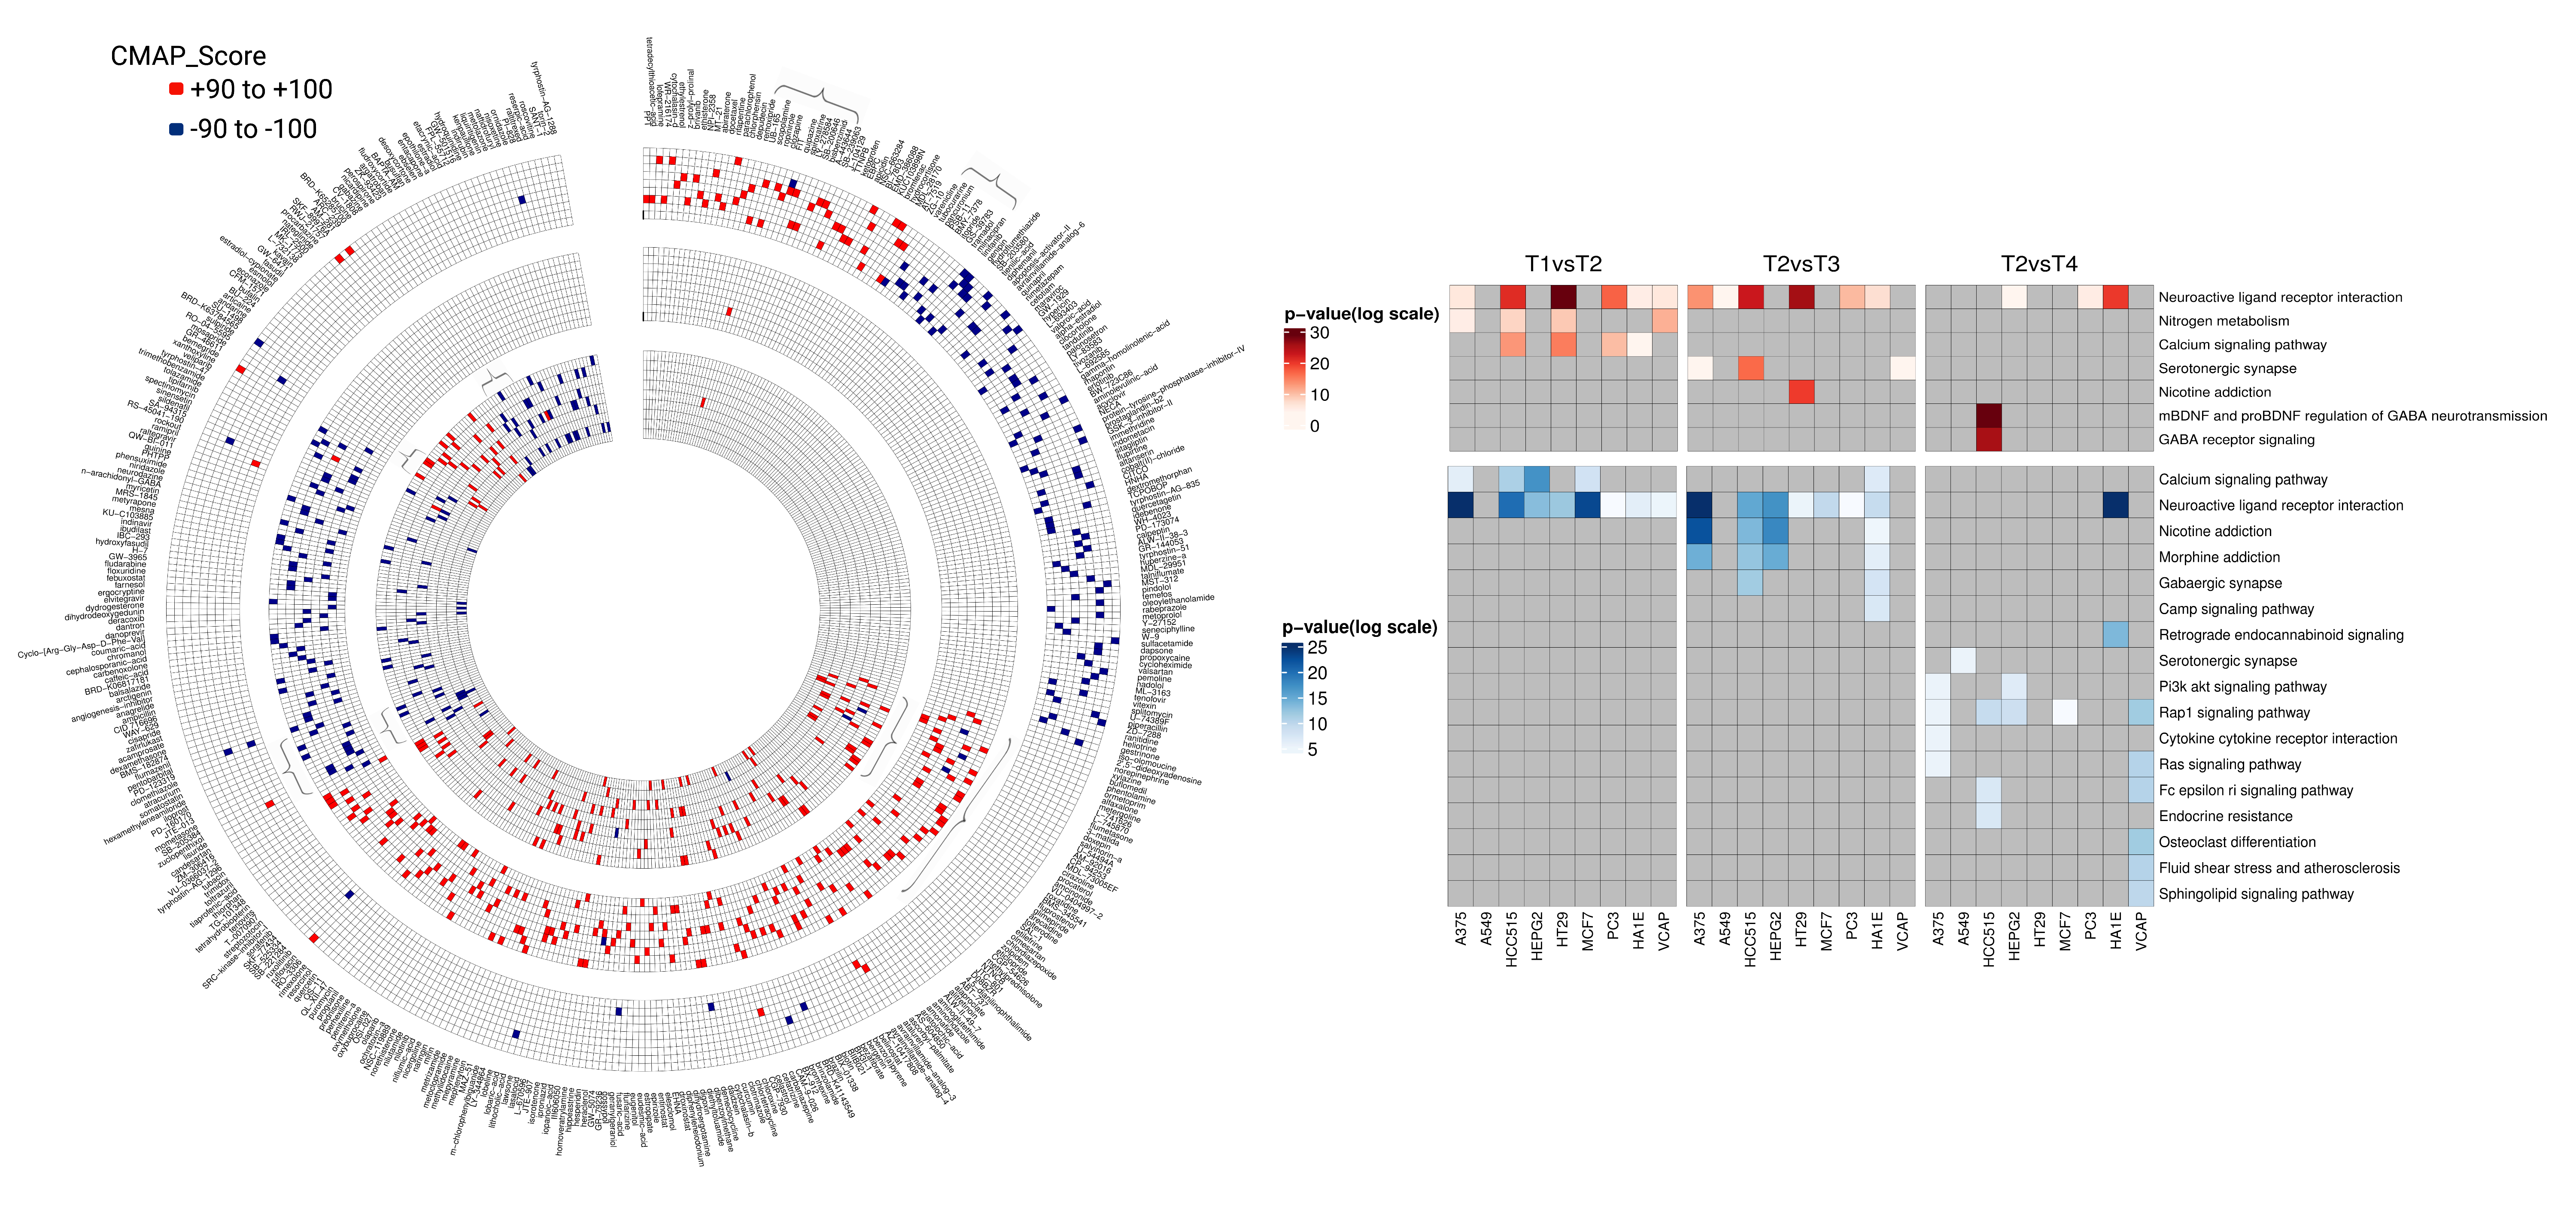
New Density based heatmap circos plot which can used for oberving the drug signatures for case and control across multiple number of cell lines. For building such type of plot, I creted two cicles and various combination of small rectangles which are arranged in such a way that each represent a drug signature for a cell line. For more information, please go through the method section of this paper
Intersample variablity

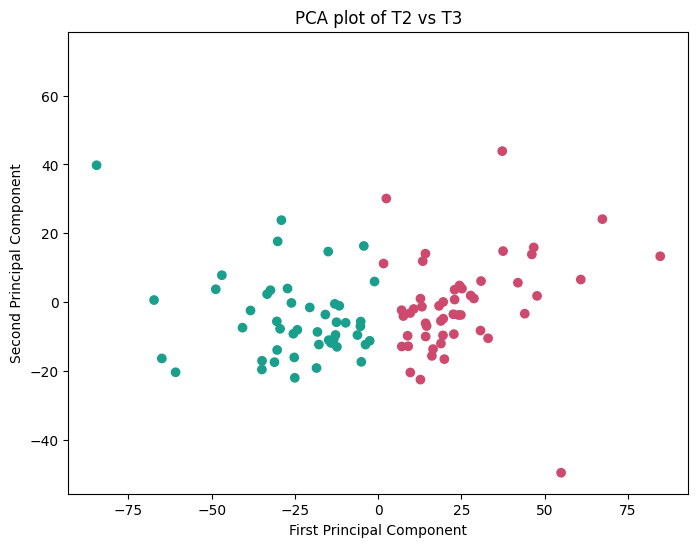
Since, using DESeq2 we can find the differentially expressed genes between the case and control. However, we can't find DEG across single sample across case and control. Inorder to find inter-sample variablity, we have see the gene expression pattern across each and every sample. So I TMM normalized the raw count table and find the logfold change value across each sample for every genes. Then I used single linkage heirarchical clustering and PCA to find the cluster of samples which are having similar gene expression pattern.


